blog
How Infographics Can Streamline and Simplify Business Processes

Running a business means handling many tasks at once. From customer services to marketing to data reports, there are many things to manage every day. So, automation is seen as the key solution to managing workflow in businesses.
Indeed, 57% of respondents said their company is piloting workflow automation in one or more business divisions or functions.
Although automation tools surely have a role, there is a robust and overlooked tool in the struggle to simplify complexity: infographics. Infographics are visual methods that simplify complex information into simple-to-read graphics. Whether presenting a workflow or monitoring progress, infographics keep it simple and easy.
In reality, according to a report, content with images is viewed 94% more than text-based content. Also, 65% of individuals are visual learners.
If you’re interested in learning how to simplify your business processes, you’ve come to the right place. Here in this article, I’ll demonstrate to you how you can use infographics to make complex business processes simpler.
What Do You Mean by Infographic Design?
An infographic is a clear and visual presentation of data and information. It relies on imagery, symbols, charts, and diagrams to simplify complicated concepts.
The simple meaning of an infographic is to communicate a story using visual aids. What this implies is that they can either be presented as a static visual or a video infographic, it all depends on what you think would best represent your subject matter and resonate with your audience.
Also, there are various types of infographics that are employed in marketing and design to convey information in a concise and visually attractive manner. Among them are
- Informational infographic: Best used to convey facts, concepts, or comparisons.
- Statistical infographic: Best to clarify numbers and data through charts and graphs.
- Process infographic: Created explicitly to divide complicated processes into steps
- Instructional infographic: Lead users through procedures or tasks
- Conversion infographic: Designed to prompt distinct actions or results
- Geographical infographics: Present location-based information
- List infographic: Present information in easy-to-read lists.
- Resume infographic: A visual method for displaying professional experience.
- Hierarchical infographics: Display hierarchy or order
Example of Infographic Design
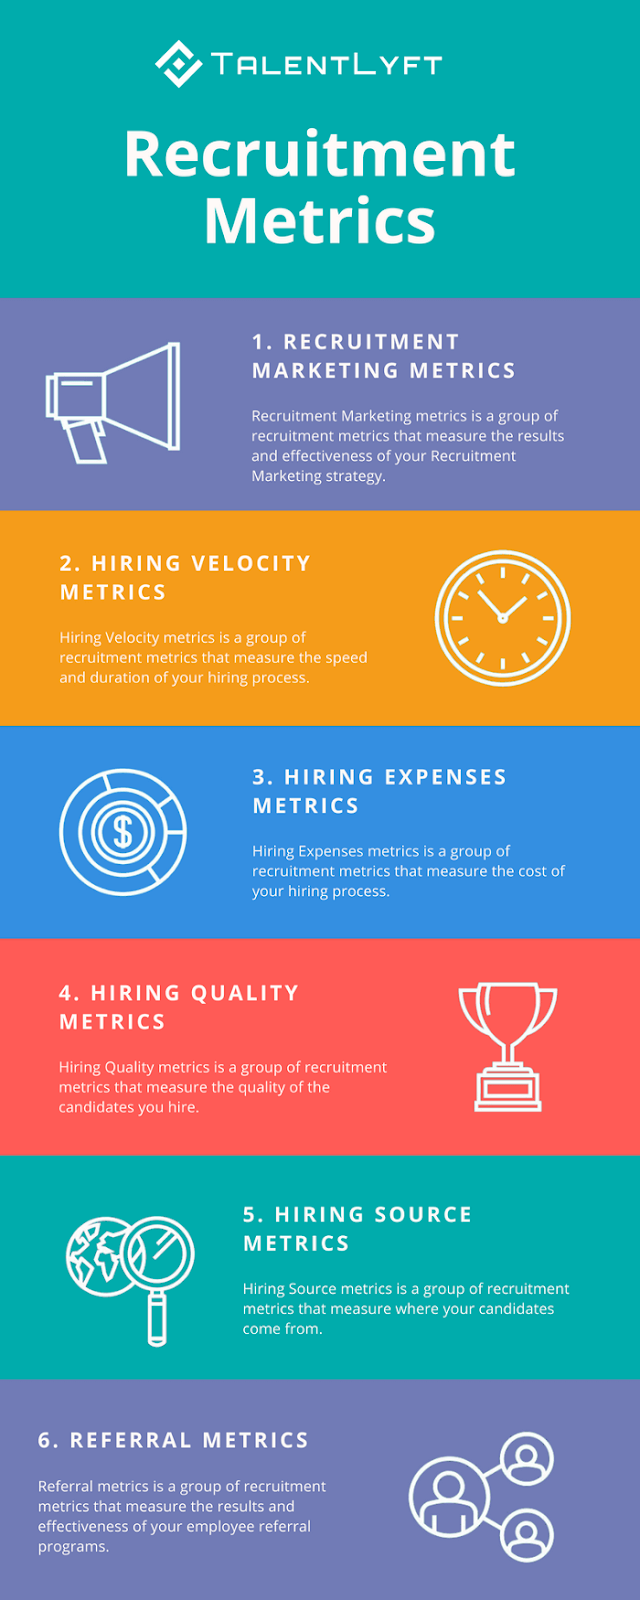
An excellent example is the TalentLyft infographic on recruitment metrics, which provides a brief but informative overview of the six essential recruitment metrics that hiring managers must be aware of and monitor.
Source: Vennage
Benefits of Infographic Design for Business Processes
Infographics are incredibly handy for all projects, whether showcasing your brand values on social media or describing a complicated process to your customers. Here’s how you can use an infographic to simplify business processes.
1. Makes Difficult Information Easier and Actionable
Infographics simplify complex data, ideas, or procedures into simple-to-understand visualizations, making them more accessible and easier for the audience to grasp.
The following are some ways that various infographic formats can streamline business procedures for different teams in your organization:
-
Statistical infographics
These infographics simplify data and numbers by using graphs, charts, and other visual aids. They work wonders for highlighting relationships in data, comparing data, and displaying trends.
Let’s say your marketing staff is going through pages of market reports. A statistical infographic can immediately identify key trends, compare competitor statistics, and show relationships within complicated sets of data with graphs and charts.
This enables your staff to quickly glean important information from daunting amounts of data, resulting in quicker, more knowledgeable strategic decisions and reduced market analysis.
-
Informational Infographics
Informational infographics are excellent for sharing facts, ideas, or comparisons. Rather than heavy policy papers, an informational infographic can display company policies or product details visually.
Merging images, words, and even minimal motion, it makes information simple yet effective, helping employees learn important policies promptly or customers know product advantages without reading paragraphs. A good infographic design agency knows how to present this in a way that’s clean and effective.
-
Geographic Infographic
Geographic infographics display a company’s geography-focused information and data. Such infographics allow easy understanding, whether it’s its office positions, worldwide market share overview, or key business highlights of all the global offices.
For example:
The image is a world map illustrating every country’s most popular fast-food brand. It uses a color-coded key to represent various brands like McDonald’s, KFC, Pizza Hut, and Burger King, showing their dominance across different regions globally.
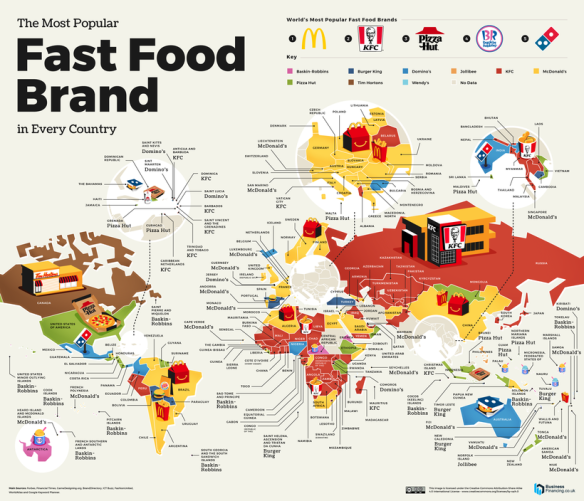
Source: Devon Geography
-
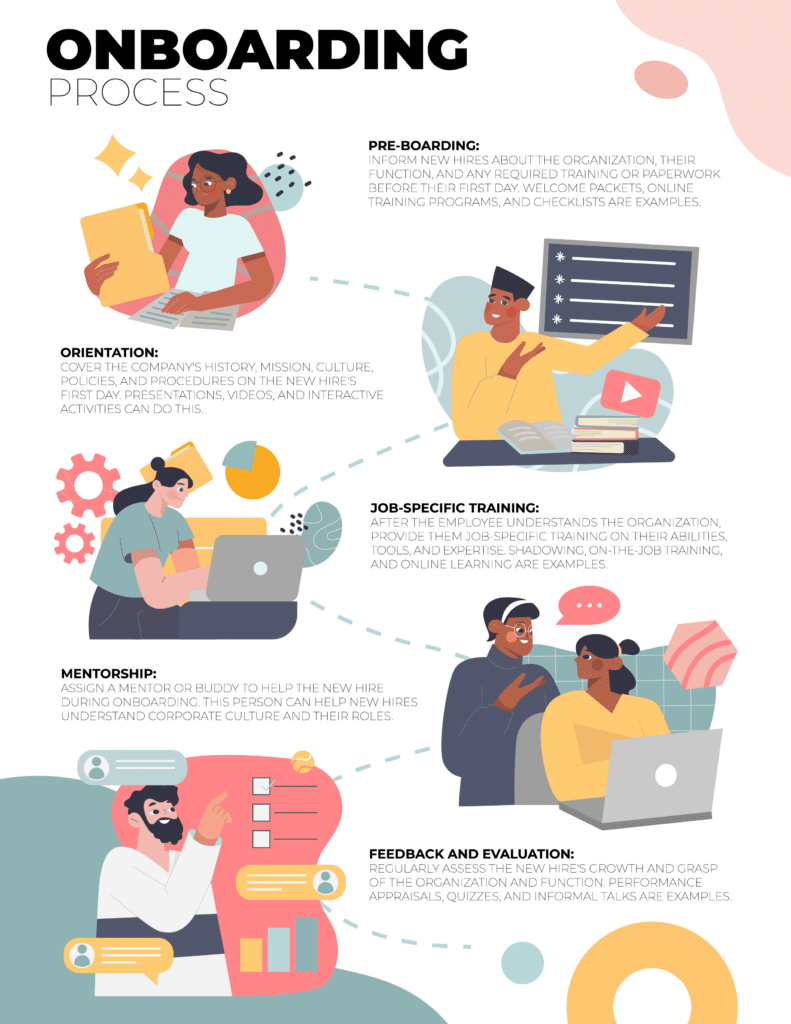
Process Infographics
Process infographics are specific infographics that help you analyze and visualize any complex process and break it down step by step.
They’re perfect for guiding new employees through onboarding, troubleshooting common issues, or outlining standard operating procedures.
2. Easily Spot Redundancies and Bottlenecks
One of the most significant benefits of infographics is that it’s easy to identify shortcomings and bottlenecks. When you visualize processes, it becomes simpler to identify mistakes and bottlenecks. This allows teams to correct problems up front, streamline processes, and eliminate steps that delay things.
It creates a much faster and more seamless flow by eliminating steps that cause delays, streamlining procedures, and addressing issues early.
Consider this infographic on “How to Deal with Bottlenecks,” for instance; it pinpoints bottlenecks and redundancies by graphically analyzing each process step.
3. Streamline Employee Onboarding and Training
Training can take time. New hires read manuals, sit in long sessions, and ask many questions. Infographics make this easier. One image can replace five pages of instructions. A single well-presented infographic can stand in for pages of instructions, enabling new employees to learn much more quickly.
Shift eLearning says visuals help people learn 400% better. This means fewer mistakes. It also means people get confident faster.
Use infographics for:
- Company rules
- Safety steps
- Customer service training
- Software guides
- Task checklists
4. Increases Brand Recognition
Infographics tell a great deal about your product offerings and your brand. The information that appears through infographics enables individuals to gauge your knowledge. To a large extent, knowledge sharing contributes significantly to people trusting your brand.
Creating and sharing captivating infographics with your brand’s colors and logo will increase brand awareness and recognition.
Moreover, graphics catch the eye and stimulate interest, making your content more shareable, discussed, and remembered among your target audience.
5. Enhances SEO
Being shareable, infographics can generate additional backlinks and search engine rankings, bringing more traffic to your site.
Share your infographics on all the appropriate social media channels and post them on your website to boost interaction. This will contribute to the creation of backlinks, which will increase search engine traffic.
Appeals to multiple learning styles:
Infographics appeal to visual, auditory, and physical learners by integrating text, images, and interactive components that suit various learning styles.
6. Simplifies Storytelling
Infographics allow companies to tell their story in a compact and visually attractive manner, enabling them to convey their message effectively. Whereas we can add many graphs or charts in the information design, you can tell a remarkable story to your readers.
An infographic enables you to create a wonderful story that individuals will find attractive and interesting, as compared to plain text.
Also, visual data is remembered better than text, and therefore infographics are a big weapon for communicating essential messages that you wish your audience to remember and recall
7. Enables Data-Driven Discussions
Infographics can be used as icebreakers, making it easy for team members to engage in data-driven discussions and adopt a more analytical problem-solving strategy.
How to Include Infographics in Your Business Process
Infographics can effectively boost many aspects of your business. Converting complex information into pictorial form can enhance communication, training, and overall productivity.
Following are some ways in which you can incorporate infographics into your business operations:
1. Develop Employee Onboarding and Training Infographics
Let’s face it, nobody likes reading long manual pages. Infographics can make training painless by breaking complicated steps into easy-to-consume, visually engaging formats.
Whether training new employees or educating users on a new software application, infographics can:
- Make the process simple
- Reduce training time
- Have employees better retain information
Source: ELM Learning
2. Utilize Infographics for Marketing and Sales
Grabbing attention is half the battle in marketing and sales, which makes infographics an exemplary tool to showcase product features, benefits, and comparisons on a visually appealing and memorable level. A social media marketer such as yourself already knows how to use visuals and infographics to involve your audience.
The example picture, showing a vibrant infographic comparing product features side-by-side, effectively demonstrates how visuals simplify complex choices for customers, boosting sales engagement.
3. Implements Infographic Internal Communication
Keeping everyone on the same page is essential to a well-oiled business. Infographics can make internal communication more interesting and keep workers up to speed, ensuring everyone’s on the same page and no longer getting lost in text walls.
However, infographics aren’t only for putting out goals and updates; they can also be practical communication tools.
- Beyond sharing goals and updates, these tools boost internal communication by clarifying complex workflows and responsibilities.
- They’re also fantastic for tracking progress at a glance, allowing teams to quickly identify milestones, bottlenecks, and successes, keeping projects on schedule.
4. Use Infographics in Project Management
Project management can be a balancing act, but infographics will keep everything on equal footing. By visually presenting the details, you keep your team on track, make informed choices, and keep projects flowing efficiently. It’s about simplifying the complicated and the disorderly.
Infographics for project management can monitor progress, graph schedules, and coordinate team members, sometimes all in one infographic.
Wrapping Up
Infographics turn hard-to-understand business tasks into clear, easy visuals. They help teams work faster, spot problems early, and train new people with less effort.
Infographics make it all simple, whether you’re explaining a process, tracking goals, or boosting brand trust. With help from an experienced infographic design agency, you can choose the right types of infographics for your business.
Are you ready to simplify your business processes and boost productivity?
At Tangence, our expert infographic design team transforms complex data into clear, engaging visuals that drive results.
Partner with a trusted infographic design agency, “Tangence,” and clarify your workflow.