blog
How Infographics Can Boost Your Thought Leadership

Do you know today’s audience has a short attention span? A Forbes report shows that the average person spends only about 54 seconds on a web page before moving on. If your content doesn’t grab attention quickly, you lose readers.
People just want a picture with a few clear words to help them understand quickly. That picture is known as an infographic. They turn complex ideas into simple visuals that are quick to scan and easy to remember.
According to recent data, 61% of people prefer infographics when learning new information, and 84% of companies that use them find them compelling.
When you share clear pictures that teach others, people trust and follow your ideas, and you become a thought leader.
What are Infographics?
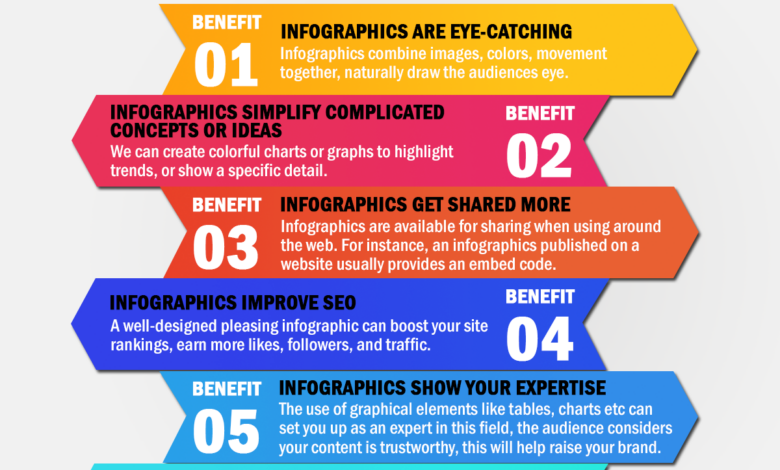
An infographic is a picture that mixes simple words, charts, icons, or small images to quickly convey a fact or idea. It could show a few big numbers, steps, or comparisons so people immediately get the message.
The Oxford English Dictionary defines an infographic, also known as an information graphic, as “a visual representation of information or data.”
These visuals help our brains learn better. A study by 3M Corporation found that people remember only 10% of what they read, 20% of what they hear, but a whopping 80% of what they see and do. That means that infographics can help folks remember your idea much longer.
Infographics are helpful because they show ideas with colors, shapes, and a few words. They work well when you want to explain something smart in a way even a kid can follow, which is why many brands turn to infographic design services to make their content clear and impactful.
Being a thought leader means people look to you for smart ideas and helpful insight. You don’t brag. Instead, you share good, trusted ideas that help others learn.
Source: Grafex Media
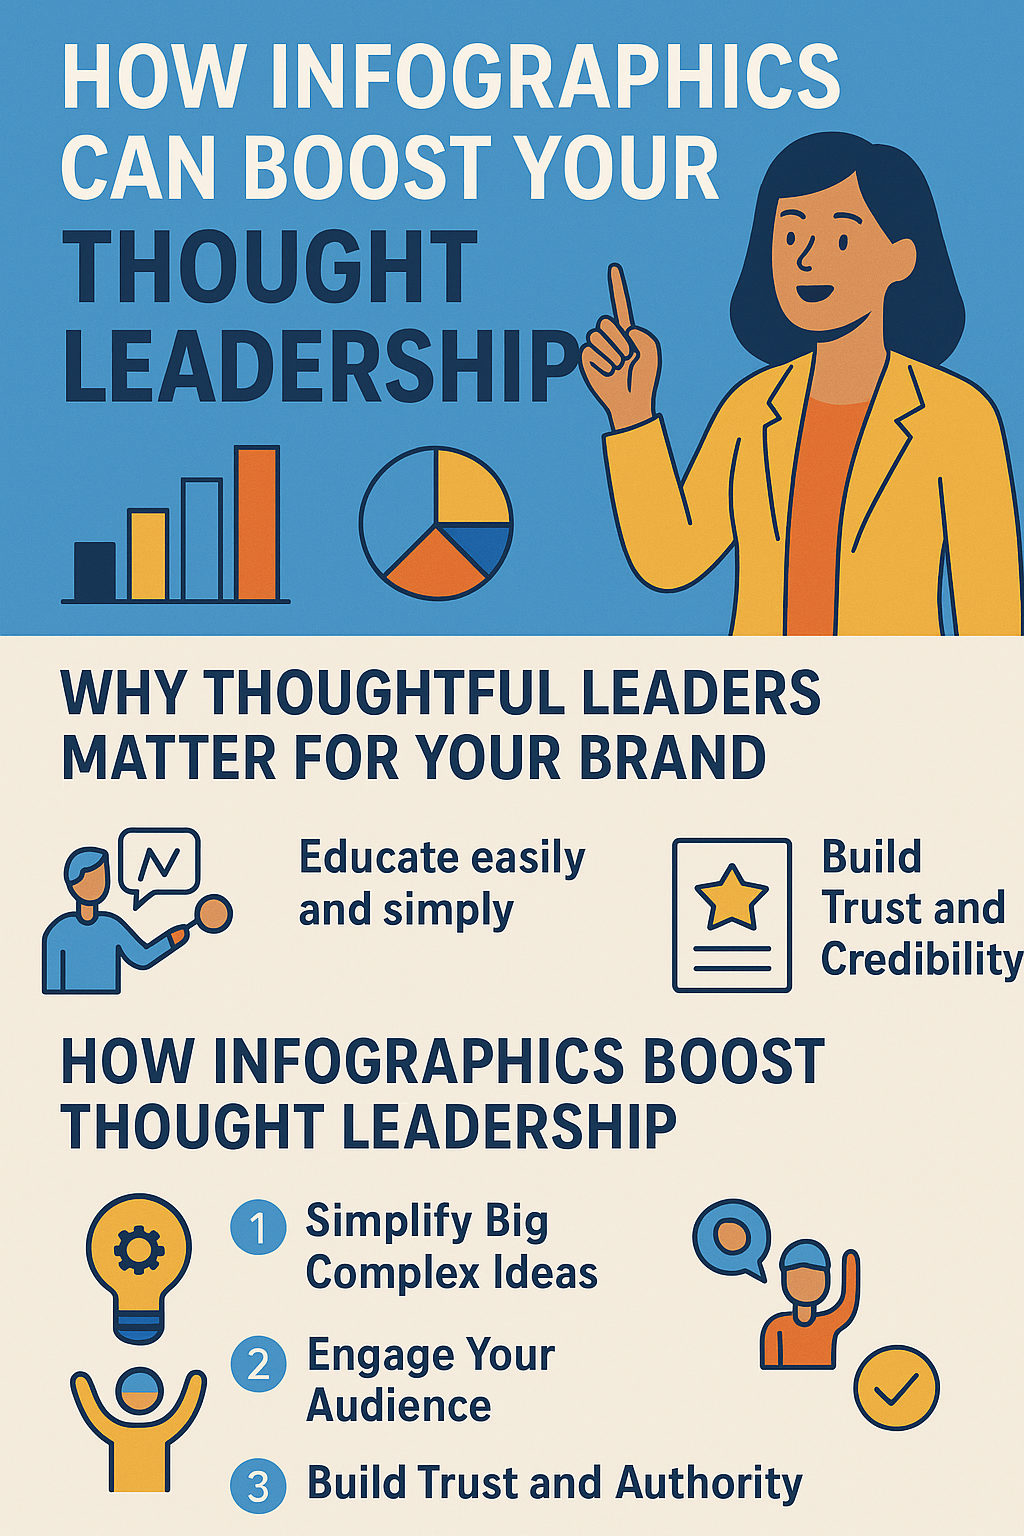
Why Thoughtful Leaders Matter for Your Brand
Though infographics are compelling, their impact relies on the approach used. A defective design or haphazard format will confuse rather than educate.
- Educate easily and simply.
- Make it stand out from regular text.
- Stand out more than plain text.
Build Trust and Credibility
As you share original research and back it up with facts, you flex your muscle. And 89% of decision-makers confirm that good thought leadership boosts their view of a firm.
Influence Decisions and Premium Positioning
Thought leadership activates immediate business value. Research shows that 60% of decision-makers will gladly pay premium prices to work with companies that position themselves as thought leaders. Infographics take the steps even further by allowing others to learn complex points quickly.
How Infographics Boost Thought Leadership
Source: ChatGPT
1. Simplify Big Complex Ideas
Thought leadership frequently addresses large, dense topics, such as describing trends in data or new concepts in simple terms. Infographics simplify these into bite-sized visuals displaying icons, figures, and short explanations that are simple to consume.
Instead of a 20-page paper on consumer behavior, you can create a one-page infographic displaying three key trends using charts, icons, and short explanations. This makes the insights quicker to learn about and simpler to recall.
Infographics are 30 times more likely to be read than an entire article.
2. Engage Your Audience
Good-looking visuals stand out, but they also engage.
Posts with visuals receive 650% more engagement than posts containing just text, and social media posts that include images stimulate 150% more engagement, likes, and sharing.
When readers stop to check out your type of infographic, they absorb your thoughts more. This solidifies the notion that you’re an expert and keeps the message in their heads.
3. Build Trust and Authority
When you display the right info clearly and visually, people trust you more. You appear knowledgeable and truthful. Trust is formed when complicated concepts come across as simple and truthful. An infographic explaining a topic demonstrates to readers that you’ve done the research and respect their time.
4. Help People Share Your Ideas
Infographics are made for sharing—short form meets eye-catching visuals.
- Stats:
- They get 3× more shares than other content.
- Articles with infographics receive 94% more views.
When people share your visuals, your ideas travel farther. That boosts your visibility and builds awareness, everyone sees your smart thinking and starts to recognize your voice.
5. Boost SEO and Backlinks
Google prefers content that is shared and linked. Both are aided by infographics. Having infographics increases website traffic by 12%. Weblogs containing infographics accrue 178% more backlinks.
More traffic and backlinks result in higher search rankings. As your content is discovered on the web, it enhances your thought leadership, recognized both by search engines and by readers.
6. Show Your Brand Clearly
Consistent visuals help people link the infographic to you, your colors, fonts, and logo build memory and trust.
- Insight: Using color in visuals can boost participation by up to 80%.When your infographics look like “you,” people start recognizing your style. This makes your content familiar and trustworthy, foundational traits of a thought leader.
7. Driving Conversations and Influence
Thought leadership involves sharing knowledge and generating conversations that shape the industry. Infographics are very shareable and best used to initiate discussions. A good infographic on LinkedIn or Twitter might result in likes, comments, and reposts, multiplying the reach beyond the immediate network.
Suppose we say an infographic on the “Key Trends in Renewable Energy for 2025” is ready. Industry professionals might forward it to the teams, add comments, or even refer to it within a presentation.
Each forward move widens the reach of the influence, solidifying the leader’s position as the voice influencing industry conversations.
8. Tell a Story with Data
Infographics might show processes or trends, or contrast the data using images such as timelines or charts to bring the figures to life.
When the data is explained and converted into story images, the folks get the rationale for the “why” of the concepts. That storytelling enables the readers to trace the logic of the thought leadership.
9. Balance Fun and Clarity
Color and punch grab attention, but they can be distracting. The most effective infographics combine bright impact with clear communication. Clarity equals thought leadership. A catchy design attracts readers; clear communication keeps them there and reminds them of it. The most effective infographics balance the two by being enjoyable yet straightforward.
Practical Tips to Use Infographics Effectively
While infographics are powerful, their effectiveness depends on the method you choose. A faulty design or cluttered format will confuse instead of educate.
Use Clear Storytelling and Design Trends
An infographic is a story. So start an infographic story off right with a compelling headline. Then, illustrate the points of your story one after the other using images. For 2025, key design trends include:
- Big typeface to be easily read.
- Whimsical formats are eye-catching.
- Interactive elements to captivate.
- Accessibility features include a readable typeface and contrast in color.
- Micro-infographics to learn from bites.
When coupled with good research, these trends might captivate audiences into receiving your infographics.
Capitalize on SEO and on Brand Identity
Infographics work towards the benefits of SEO when used judiciously. Using the alt text, keyword-rich filenames, and embedding infographics into blogs enables the search engine crawlers to index the content.
For example, terms like “infographic design services” naturally appear in the content, enhancing search visibility. Meanwhile, incorporate your brand color palette, typeface, and logo into the design so that others associate it with yours.
Maintaining Authenticity of Your Content in the Era of AI
It is now simpler than ever before to produce graphics and even write full posts using the AI tools. Authenticity is the secret to genuine thought leadership. People spot right away when the content feels generic. To remain credible:
- Always fact-check the data before designing.
- Add original insights that AI cannot replicate.
- Maintain a human voice in captions and headlines.
A recent study highlights that while AI-generated infographics can engage users, human-curated designs build stronger trust and long-term retention. That’s why blending technology with authenticity is the winning formula, and taking help from infographic design services helps.
Wrapping Up
Infographics are anything but eye candy. They’re credibility-building devices that allow professionals to articulate concepts simply, reach broader audiences, and forge strong reputations.
From enhancing SEO to making credibility-building statements to decision-makers, the value of infographics to thought leadership cannot be denied.
As content continues to increase in volume, visuals will differentiate the brands. Merging your expertise with top-notch infographic design services will ensure the insights are viewed, comprehended, and retained.
The next time you’re developing a strategy, challenge yourself thus: how would an infographic clarify and solidify this idea better? The solution might just unlock the potential to grow into a thought leader.